And uh, isn’t he basically calling the other chicken a deviant? (little more word-play for you math nerds) that’s not a compliment to most people…especially early in a relationship….
Can someone please explain to me exactly what this cartoon means? Im in statistics now so i somewhat understand but not fully. Can someone help me please?!?!
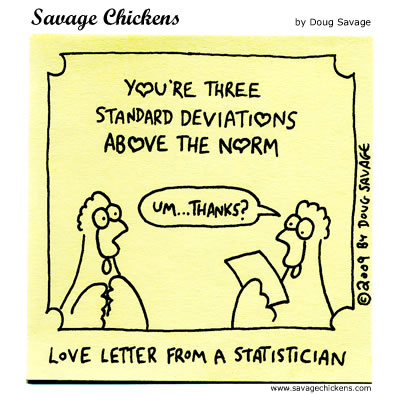
Hi Sarah! I drew this when I was taking a statistics class at the university here. Good luck with your class – it’s tricky stuff! Let’s see if I can remember any of it…
Standard deviations are used to measure how much variation there is in a set of results, and they can be used to show how far something is from the average. If you’re one standard deviation above average, then you’re better than most. If you’re three standard deviations above the norm, then you’re about as awesome as you can get.
For example, if your final mark in statistics is three standard deviations above the average, then it probably means you got the highest mark in the class. Here’s hoping it happens! 🙂
This was used on a PowerPoint in one of my lectures at uni! It was one of the introduction to research methods lectures! (I study psychology and criminology)


Wow, that makes love a fact! 🙂 And I love the expectant look on the statistician chicken!
See also xkcd for more statistics and love. Great strip as always, Doug!
aww, that totally swept this math nerd off her feet! =)
Very high praise from the mathematically inclined. This made me smile.
He forgot to say approximately three deviations…hehe
On the other hand, people are always saying I’m “mean” and I don’t think they are talking about statistics, for some odd reason.
He’s clearly in 2.(9)
And uh, isn’t he basically calling the other chicken a deviant? (little more word-play for you math nerds) that’s not a compliment to most people…especially early in a relationship….
Statistically, that makes them adequate…
being a deviant is high praise indeed!
Come on Antonio, statisticians never conclude to fact. Wonderful comic nonetheless.
A real statistician would need to proof this proposition.
Shortest math joke: ?<0
&=^
The hearts are that little detail that make the difference. Good one!
Thanks to the title of today’s cartoon, I’ve had the song “Love Cats” stuck in my head all day.
I’m taking a night course in behavioural statistics so that’s where this cartoon came from.
@Dan
Sure, stats are no facts, but they are treated like facts by most people/trolls I know on the net. 😀
I’m taking stats now so this finally means something to me, which is really the only reason anyone goes to college, to get all the jokes.
Can someone please explain to me exactly what this cartoon means? Im in statistics now so i somewhat understand but not fully. Can someone help me please?!?!
Hi Sarah! I drew this when I was taking a statistics class at the university here. Good luck with your class – it’s tricky stuff! Let’s see if I can remember any of it…
Standard deviations are used to measure how much variation there is in a set of results, and they can be used to show how far something is from the average. If you’re one standard deviation above average, then you’re better than most. If you’re three standard deviations above the norm, then you’re about as awesome as you can get.
For example, if your final mark in statistics is three standard deviations above the average, then it probably means you got the highest mark in the class. Here’s hoping it happens! 🙂
I love this cartoon, just finished taking biostatistics in college and found this cartoon hilarious thank you
This was used on a PowerPoint in one of my lectures at uni! It was one of the introduction to research methods lectures! (I study psychology and criminology)